Funkcja StemBar
 Bezpośrednią inspiracją do napisania funkcji StemBar była potrzeba wizualizacji danych w przestrzeni XYZ, w taki sposób aby za pomocą wzrokowej oceny można było wychwycić ewentualną zależność w prezentowanym zbiorze danych. Środowisko matlab posiada wiele funkcj rysujących w 2D i 3D i wydawałoby się, że ta liczba jest wystarczająca, a jednak nie... Okazuje się, że brak takiej funkcji odczułem nie tylko ja. Przykładem może być wątek na forum matlaba "is there any bar graph equivalent to stem3" z 2008 roku.
Opis algorytmu
W krótce pojawi się opis algorytmu wraz z przykładami użycia funkcji.
Kod źródłowy
function h = StemBar(x,y,z,color,width)
% h = StemBar(x,y,z,color,width)
% Function is similar to stem3, but instead of lines with markers plotting
% 3d bars
%
% Usage:
% StemBar(x,y,z) - draws bars with a height z at the values specified in x
% and y. x, y, z - should be a vectors.
% StemBar(z) - draws bars with a height z at the xy-plane
% StemBar(...,color) - If color is a single character string chosen from the
% list 'r','g','b', 'c','m','y','w','k', or an RGB row vector triple,
% [r g b], the bars are filled with the constant specified color. If color
% is matrix size numel(x)*6 each faces will be filled with specified color
% in the corresponding row.
% StemBar(...,width) - specified a width of bars
% h = StemBar(...) - return a handle
%
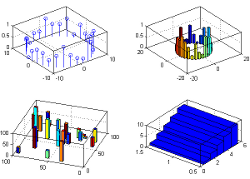
% example:
% StemBar(100*rand(25,1),100*rand(25,1),100*rand(25,1),rand(150,1)',2)
%
% Author: Grzegorz Knor
% e-mail: gknor@ippt.gov.pl
if nargin < 5
width = .5;
end
if nargin < 4
color = [0 0 1];
end
if nargin==1
y = ones(size(x));
z = x;
x = 1:numel(x);
elseif nargin==2
z = x;
x = 1:numel(x);
elseif nargin==0
error('Not enough input arguments.')
elseif nargin > 5
error('Too many input arguments.')
end
% check the size of input arguments
if length(x)~=numel(x) || length(y)~=numel(y) || length(y)~=numel(y)
error('Input argument x, y, z should be a vetors.')
end
if numel(x)~=numel(y) || numel(x)~=numel(z) || numel(y)~=numel(z)
error('Vectors must be the same lengths.')
end
% making a rows vectors
x = x(:)';
y = y(:)';
z = z(:)';
% defining a cube
xx = [-1 1 1 -1 -1 -1;
1 1 -1 -1 1 1;
1 1 -1 -1 1 1;
-1 1 1 -1 -1 -1]*width;
yy = [-1 -1 1 1 -1 -1;
-1 1 1 -1 -1 -1;
-1 1 1 -1 1 1;
-1 -1 1 1 1 1]*width;
zz = [0 0 0 0 0 1;
0 0 0 0 0 1;
1 1 1 1 0 1;
1 1 1 1 0 1];
% specyfing x, y and coordinates
xx = kron(x,ones(4,6))+repmat(xx,1,length(x));
yy = kron(y,ones(4,6))+repmat(yy,1,length(y));
zz = kron(z,zz);
% draw with fill3 function
hh = fill3(xx,yy,zz,color);
% return a handle if necessary
if nargout == 1
h = hh;
elseif nargout >1
error('Too many output arguments')
end
%EOF:~
Do pobrania
Omawianą funkcję można pobrać ze strony mathworks.com >>